InstaCharts

InstaCharts

Graph Data Trends Quickly

162 followers

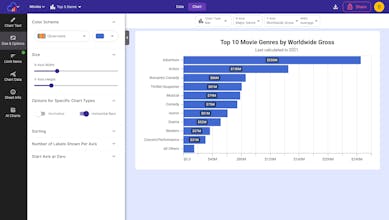
Visualize data with a no-code online chart maker. Instantly convert spreadsheet or google sheets files to charts and graphs. Export, share and embed charts into webpages.
InstaCharts gallery image
Free Options
Launch Team / Built With
Checkmarx Developer Assist for AI IDEs
Security linter for vibe coding: fix vulns as you build
Promoted

What do you think? …

Bart Howe
Hey Product Hunt community! šŸ‘‹ I'm Bart, the founder of InstaCharts, and I'm excited to introduce our tool to you today. As a long-time data enthusiast and former engineering lead, I've always been frustrated by how time-consuming it can be to create clear, impactful charts. That's why we built InstaCharts – to make data visualization fast, easy, and actually enjoyable! šŸš€ What is InstaCharts? InstaCharts is an online platform that lets you create interactive charts in seconds. Whether you're a data pro, a marketer crafting reports, or a student working on a project, InstaCharts is designed to simplify your workflow and help you tell compelling data stories. ✨ Key Features: - Easy to use interface: No coding required! - 11 chart types: From basic bar charts to embeddable data tables - One-click exports: Save your work in various formats (PNG, SVG, CSV, XLSX and more) - Data source integrations: Connect directly to Google Sheets, Excel, CSV, and various text file types including JSON. - Supports raw data ingestion: no cleaning required! - Supports data transformations: filtering, aggregation, pivot and unpivot - Share interactive charts through a public link or embed charts into webpages šŸŽØ Why we're different: We've put a lot of focus on making InstaCharts not just powerful, but also easy to use. Our "Chart Recommendations" feature analyzes your data and recommends the best visualization types. And with our wide array of customizations, you can create professional-looking charts in no time. šŸ†“ Special for Product Hunters: We're offering an exclusive 50% off forever coupon to the PH community. Just use the code PRODUCTHUNT2024 when signing up. (new sign ups only!) I'd love to hear your thoughts and feedback. What features would make InstaCharts a must-have tool for your data visualization needs? Let's chat in the comments! Happy hunting! šŸ“ŠāœØ
Pradhumn Vijayvargiya
@insta_bart_howe Google sheet's data visualization sucks big time, been trying few other tools to get better visualization from my Google sheet. Will definitely give it a spin and let you know!
@insta_bart_howe Congrats on the launch! Wishing you and your team an exciting journey ahead. What inspired you to create this?
Bart Howe
@prad_vv Definitely let us know how it goes!
Bart Howe
@kjosephabraham Thank you! InstaCharts was inspired by a problem I had myself - it took me too long to make one off charts in excel. I wished I could upload a csv file somewhere and have a chart instantly made for me. Thus, InstaCharts was (eventually) born! šŸ‘¶
Eric
Aleksa Mitrović
@insta_bart_howe super cool. Do you maybe have the entire dashboard creation?
Bart Howe
@1aleksa Dashboards would be amazing! We don't currently offer dashboards, maybe next year!
Kyrylo Silin
Hey Bart, I’m wondering, how does InstaCharts handle more complex datasets, and are there plans to expand the chart types available? Congrats on the launch!
Bart Howe
@kyrylosilin Thank you! We analyze and catalog the dataset, then recommend and guide the user to an appropriate chart. It turns out it doesn't matter how complex the dataset is, the user ultimately chooses what they'd like to see in a chart. We would love to offer more chart types - we're hoping to launch radar charts later this year.
Andy Hwang
Impressive tool for quick data visualization. The no-code approach and Google Sheets integration could be game-changers for non-technical users. Curious about the AI behind the chart recommendations - how accurate are they? The embed feature is great for content creators. Wonder how it handles very large datasets or complex visualizations. Could be a solid alternative to more complex tools for many use cases. Interested to see how it evolves based on user feedback.
Bart Howe
@andyroamer Thank you! The AI behind the recommendations isn't true AI, its a set of rules our team came up with to apply sane default settings to a chart based on the data provided. It's pretty accurate but could use more work. Users trust us with their data - we did not want to expose it to 3rd party AI tools and models without their explicit permission. We can handle datasets up to 100k rows, anything more than that and we're headed out of non technical user land and into BI territory. Which the tool could evolve into - our team is open to the challenge!
IstvƔn MƩszƔros
I love the simplicity of this! How hard it would be to make it work for something like BigQuery?
Bart Howe
@istvanmeszaros88 Thank you! Adding database connectors is a bit of work, but something our team is very interested in as well. Stay tuned!
Ruben Hassid
Nailing one precise feature. That's what we want from SaaS.
Bart Howe
@rubenhassid Thank you! I agree 100%.
Jacques Erasmus
InstaCharts looks like an amazing tool for quickly creating and sharing data visualizations! The ability to connect to various data sources and instantly generate charts is super convenient. I love the fact that you can customize everything from chart type to colors and even share interactive charts with a simple link. Excited to see how this can speed up my workflow!
Bart Howe
@jerasmus Thank you! Let us know how it goes!
12
Next
Last