
Data Analytics Course in Hyderabad
with
100% Placement Assistance
- Learn from Industry Experts
- Industry Ready Curriculum
- Start From Foundation Level of Training
Join our hands-on training program and become a data analytics professional.
| Trainer Name | Ms. Shaheda Tabassum (Certified Trainer) |
| Trainer Experience | 7+ Years |
| Next Batch Date | 2nd April 2025 (8:00 PM IST) |
| Training Modes | Online / Offline |
| Course Duration | 3 Months |
| Call us at | +91 9948801222 |
| Email Us at | dataanalyticsmasters.in@gmail.com |
| Demo Class Details | ENROLL FOR FREE DEMO CLASSES |
Data Analytics Training in Hyderabad
Course Curriculum
Module 1: Introduction to Data Analytics
- What is data?: what exactly is data and its importance.
- Overview of Data Analytics: Importance of data analytics in today’s business landscape.
- Types of Data Analytics: Descriptive, Diagnostic, Predictive, and Prescriptive Analytics.
- Data Analytics Tools: Introduction to popular tools like Excel, R, and Python.
- Understanding the Analytics Lifecycle: From data collection to decision-making.
Module 2: Data Collection & Data Cleaning
- Data Collection Methods: Sources of data and data types (structured, unstructured).
- Data Quality and Preprocessing: Identifying missing values, handling outliers, and data imputation.
- Data Cleaning Techniques: Removing duplicates, data transformation, normalization, and standardization.
- Handling Categorical and Numerical Data: Encoding techniques (Label Encoding, One-Hot Encoding).
Module 3: Data Visualization
- Introduction to Data Visualization: Why visualization is essential in data analytics.
- Using Excel for Visualization: Creating basic charts like bar graphs, histograms, scatter plots.
- Advanced Visualization Tools: Introduction to Power BI and Tableau for interactive visualizations.
- Principles of Effective Visualization: Design best practices for clarity and impact.
- Hands-On Project: Visualizing a real-world dataset using Power BI/Tableau.
Module 4: Statistical Analysis for Data Analytics
- Descriptive Statistics: Mean, median, mode, range, variance, and standard deviation.
- Inferential Statistics: Hypothesis testing, confidence intervals, and p-values.
- Correlation and Regression: Analyzing relationships between variables.
- Data Distribution: Normal distribution, skewness, kurtosis, and how they affect analysis.
Module 5: Introduction to Python for Data Analytics
- Python Basics: Python syntax, variables, data structures (lists, dictionaries).
- Working with Data in Python: Using libraries like Pandas and NumPy for data manipulation.
- Data Cleaning and Preprocessing in Python: Techniques for handling missing data, duplicates, and outliers.
- Visualization in Python: Introduction to Matplotlib and Seaborn for basic visualizations.
Module 6: Exploratory Data Analysis (EDA)
- Understanding EDA: Why EDA is crucial for every data analysis project.
- Univariate & Bivariate Analysis: Exploring individual and relationships between variables.
- Visualizing Data: Plotting distributions, correlations, and trends.
- Handling Skewed Data: Techniques to deal with non-normal distributions.
- Hands-On Project: Conducting EDA on a real-world dataset.
Module 7: Predictive Analytics & Machine Learning
- Introduction to Machine Learning: Understanding the basics of supervised and unsupervised learning.
- Linear Regression: Implementing linear regression for predictive analytics.
- Classification Algorithms: Logistic regression, Decision Trees, Random Forests.
- Model Evaluation Metrics: Accuracy, Precision, Recall, F1-Score, ROC Curve.
- Hands-On Project: Building a simple machine learning model using Python.
Module 8: Time Series Analysis
- Introduction to Time Series: What is time series data, and how is it different from other types?
- Time Series Components: Trend, Seasonality, and Noise.
- Forecasting Methods: Moving averages, ARIMA model.
- Hands-On Project: Time series forecasting using Python.
Module 9: Big Data & Cloud Analytics
- Big Data Concepts: Introduction to Big Data, Hadoop, and Spark.
- Data Storage & Cloud Computing: Basics of cloud technologies like AWS and Google Cloud for data storage and analytics.
- Data Warehousing: Overview of data lakes and data warehouses.
- Hands-On Project: Analyzing a large dataset using cloud tools.
Module 10: Real-World Data Analytics Project
- Project Planning: How to approach a data analytics project from start to finish.
- Data Gathering and Cleaning: Preparing the data for analysis.
- Model Building and Evaluation: Applying machine learning models and assessing their performance.
- Presentation of Findings: Creating impactful visualizations and reports to present findings to stakeholders.
Module 11: Career Preparation & Job Readiness
- Creating a Portfolio: How to build a professional data analytics portfolio showcasing your skills.
- Resume Building and LinkedIn Optimization: Tips for creating a data science/analytics resume and optimizing your LinkedIn profile.
- Interview Preparation: Common interview questions and how to prepare for data analyst roles.
- Networking: How to network effectively in the data analytics industry.
Module 12: Assignments & Mock interviews
- Daily Assignments
- Weekly Mock tests
Module 13: Resume Preparation
- Industry and ATS Friendly Resume Preparation.
Module 14: Final Project
Data Analyst Training in Hyderabad
Trainer Profile: Ms. Shaheda Tabassum

Ms. Shaheda Tabassum
Data Science Expert | 7+ Years of Experience
- Ms. Shaheda Tabassum is a Data Science professional with over 7 years of experience working with top organizations. She specializes in Data Analytics, Machine Learning, and Data Visualization, using tools like Python, Tableau, Power BI, and Excel.
- With a passion for teaching, Ms. Shaheda makes complex concepts easy to understand and provides hands-on learning to ensure students gain real-world experience. Her personalized approach helps students progress at their own pace, ensuring they are job-ready by the end of the course.
Key Highlights:
- Over 7 years of industry experience in Data Science.
- Expertise in tools like Python, Power BI, Tableau, and SQL.
- Master’s Degree in Computer Science and industry-recognized certifications.
- Proven success in mentoring students who secure top roles in Data Science and Analytics.
Learn from Ms. Shaheda Tabassum and gain the practical skills needed for a successful career in Data Analytics!
Data Analytics Training in Hyderabad
Training Modes
Classroom Training
- Interactive Face-to-Face Teaching
- Industry Expert Trainers
- One-on-One Support
- Collaborative Environment
- Hands-on Industry Projects
- Group Discussions
- Covers Advanced Topics
Online Training
- Virtual Learning Sessions
- Daily Session Recordings
- Instructor Support
- Interactive Webinars
- Digital Learning Modules
- Online Practical Labs
- Flexible Learning Schedules
Corporate Training
- Customised Training Programs
- Daily Recordings
- Interactive Team Development
- Expert Instruction
- Industry-Relevant Content
- Performance Monitoring
- On-Site Workshops
Why Choose Our Data Analytics Course
Learn from Industry Expert
- Get trained by Ms. Shaheda Tabassum, a seasoned expert with 7+ years of real-world experience. Learn exactly what employers look for.
Hands-on Learning with Real Projects
- Work on real datasets and industry-relevant projects to build job-ready skills.
Affordable and Flexible Payment Plans
- Pay in installments or get special discounts for full payment.
Comprehensive Curriculum for All Levels
- Covers everything from beginner to advanced, including Python, SQL, ML, and Data Visualization.
Lifetime Access to Course Materials
- Enjoy unlimited access to recorded sessions and updates, even after completion.
Job Assistance and Career Support
- Get resume building, interview prep, and access to industry connections for better job opportunities.
Small Batch Sizes for Personalized Learning
- Enjoy direct access to the instructor for a more interactive learning experience.
Latest Industry Tools and Techniques
- Stay ahead with Python, Tableau, Power BI, and SQL, ensuring relevant, up-to-date skills.
Practical Learning Over Theory
- Focus on real-world applications instead of just lectures
Strong Alumni Network
- Connect with a growing community of successful professionals in top companies.
Data Analytics Course in Hyderabad
Tools Covered
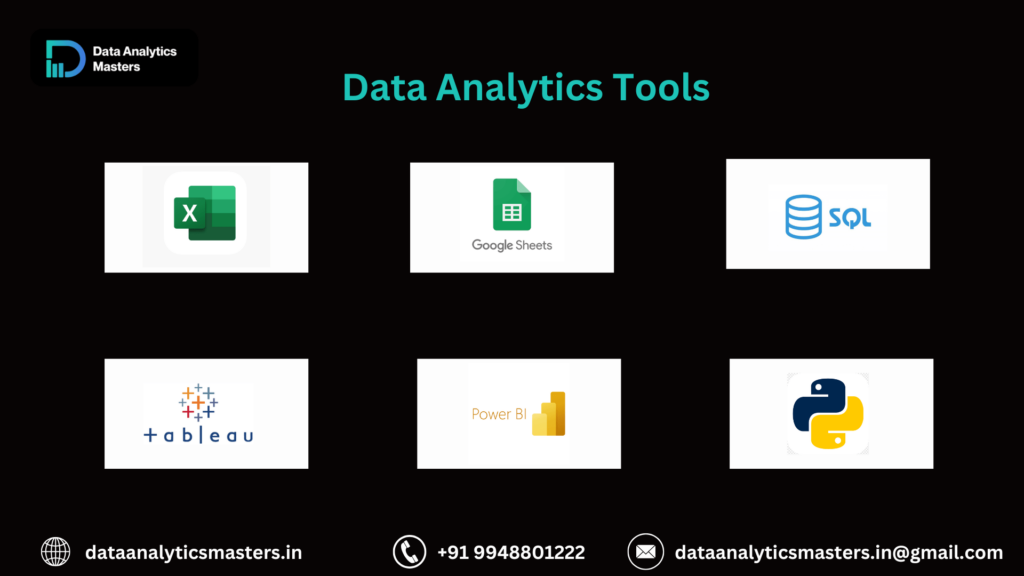
Power BI is a user-friendly business analytics tool that helps you visualize and share insights from your data. With its interactive dashboards and easy-to-understand reports, Power BI enables businesses to make informed decisions by turning data into actionable information.
R is a programming language used for statistical analysis and data visualization. It allows you to manipulate data, perform complex calculations, and create clear, informative graphs, making it a powerful tool for data analysis and research.
Microsoft Excel is a key tool in data analytics for organizing, analyzing, and visualizing data. It helps analysts clean data, perform calculations, and create charts to uncover trends and insights, making it essential for data-driven decision-making.
SQL (Structured Query Language) is a language used to manage and analyze data in databases. It allows you to easily retrieve, update, and organize data, making it an essential tool for data analysis and decision-making.
Pandas is a Python library that makes working with data simple and efficient. It helps you organize, analyze, and manipulate data with ease, making it an essential tool for data analytics and machine learning projects.
Tableau is a powerful data visualization tool that helps you turn complex data into interactive, easy-to-understand charts and dashboards. It allows users to explore data visually, uncover trends, and make data-driven decisions quickly and effectively.
Skills developed after Our Data Analytics Course
Data analysis and interpretation skills are developed, enabling you to identify meaningful patterns and trends in data.
You gain the ability to create impactful data visualizations using tools like Tableau and Power BI to make complex data easily understandable.
A strong understanding of statistics is built, which helps in making data-driven decisions and deriving insights.
Programming skills in languages like Python, R, and SQL are acquired, which allow you to manipulate large datasets effectively.
A strong foundation in math is important, especially algebra, as it helps in applying analytical techniques to data.
Data cleaning and preparation techniques are learned, ensuring that raw data is organized and ready for analysis.
A basic understanding of machine learning is gained, enabling the application of algorithms to make predictions and uncover deeper insights.
The ability to generate actionable business insights is developed, using data to drive better decision-making and strategies.
Data Analytics Certification Training in Hyderabad
Get Certified and Boost Your Career
- Upon completing our Data Analytics Course, you’ll receive a Certification that demonstrates your expertise and helps you stand out to top employers.
Why Our Certification Matters:
- Industry-Recognized: Our certification is respected by employers across industries and proves you have the skills needed for a career in data analytics.
- Real-World Projects: You’ll earn your certification by completing hands-on projects, ensuring you’re ready for the job market.
- Career Advancement: The certification adds value to your resume, boosting your job prospects and earning potential.
Top Data Analyst Certifications You Can Pursue:
- Google Data Analytics Professional Certificate
- Microsoft Certified: Data Analyst Associate
- Certified Analytics Professional (CAP)
- Tableau Desktop Specialist
- IBM Data Science Professional Certificate
Placement Program Of Our Data Analytics Training Institute in Hyderabad
Land Your Dream Job With Data Analytics Masters
- At Data Analytics Masters, our mission is not only to equip you with the skills needed to excel in data analytics but also to help you launch your career. That’s why we offer Placement Assistance to guide you through your job search and connect you with top companies in the industry.
What We Offer At Data Analytics masters
- Additionally, the institute provides access to a network of industry connections and job openings through partnerships with leading tech companies.
- Intensive 3-Month Curriculum: Engage in a rigorous, hands-on training program complete with assignments and tasks designed to build deep expertise.
- Comprehensive Project Execution: Gain real-time experience by implementing end-to-end projects that mirror industry practices.
- Capstone Projects: Work on multiple capstone projects to solidify your skills and showcase your capabilities in Generative AI.
- Practical Work Experience: Acquire hands-on experience that prepares you for the challenges of a professional environment.
- Interview Preparation: Receive expert guidance to excel in job interviews, with focused preparation on key topics and scenarios.
- Simulated Work Environment: Immerse yourself in a realistic work environment that prepares you for the demands of the industry.
Our Students are Working At

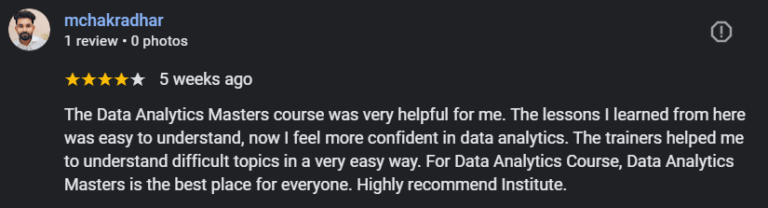
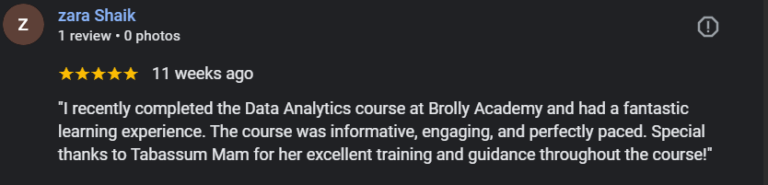
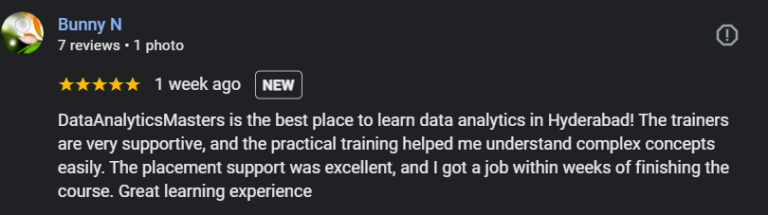
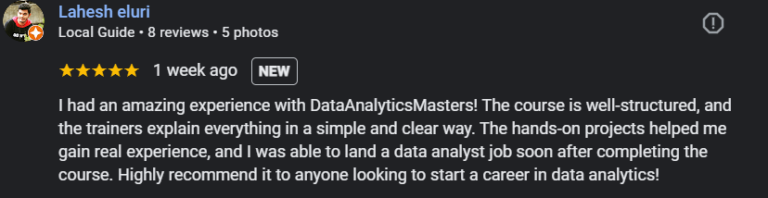
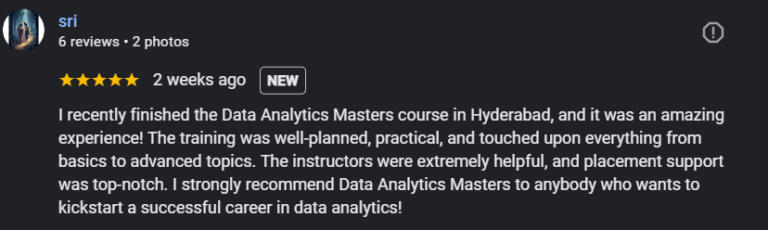
Our Students Testimonials


What is Data Analytics?
- Data analytics involves examining large sets of data to uncover patterns and trends.
- Data analytics is done with the help of tools and software.
- It helps organizations make data-driven decisions and improve business strategies.
- The process includes data collection, cleaning, and transforming raw data into useful insights.
- Techniques like statistical analysis, machine learning, and data mining are commonly used.
- Data analytics is used to predict future trends, behaviors, and outcomes.
- Data analytics helps in risk management by identifying potential issues before they arise.
- It supports decision-making by providing actionable, data-backed information.
- If you are looking to learn Data Analytics training in Hyderabad then our Data Analytics course is the best option.
Why Data Analytics?
In-Demand Skill: Data analytics is one of the most sought-after skills in various industries, offering abundant job opportunities across sectors like healthcare, finance, retail, and technology.
Improves Decision-Making: With data analytics, you can transform raw data into valuable insights, enabling informed decision-making that drives business success and strategy.
Boosts Career Growth: Learning data analytics opens up career advancement opportunities, as many organizations prefer professionals who can use data to solve complex problems and increase efficiency.
Enhances Problem-Solving Abilities: Mastering data analytics hones your ability to approach and solve problems using data-driven methods, which can be applied to both professional and personal challenges.
Increases Productivity: By automating repetitive tasks and using data to optimize processes, data analytics helps organizations streamline operations and improve overall productivity.
Versatile Application: Data analytics skills can be applied to various fields like marketing, sports, healthcare, and education, making it a versatile and transferable skill.
Competitive Advantage: Professionals with data analytics skills can offer a competitive edge to employers by providing insights that improve business performance and customer satisfaction.
Foundation for Future Technologies: As technologies like artificial intelligence and machine learning grow, data analytics serves as the foundational skill to understand and implement these advanced tools effectively.
Where is Data Analytics Used?
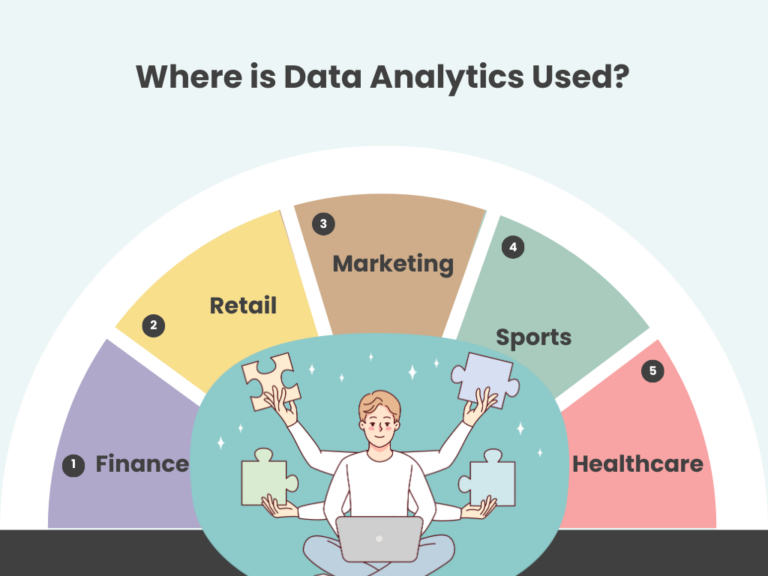
Finance : In the financial sector, data analytics helps in detecting fraud, managing risk, forecasting market trends, and making data-driven investment decisions.
Retail : Retailers use data analytics to understand customer behavior, optimize inventory, personalize marketing campaigns, and enhance the overall shopping experience.
Marketing: Data analytics is essential in marketing for measuring campaign effectiveness, segmenting audiences, predicting consumer preferences, and maximizing return on investment (ROI) from marketing efforts.
Sports : In sports, data analytics is used to analyze player performance, optimize strategies, predict outcomes, and improve team management, all of which contribute to better results on and off the field.
Health Care : Data analytics is used in healthcare to improve patient outcomes by analyzing medical data, optimizing treatment plans, predicting disease outbreaks, and streamlining hospital operations.
transport and logistics :Data analytics in transport and logistics optimizes routes, reduces fuel costs, and enhances delivery efficiency using real-time tracking and predictive analytics. It also helps in demand forecasting, fleet management, and minimizing delays for better supply chain performance.
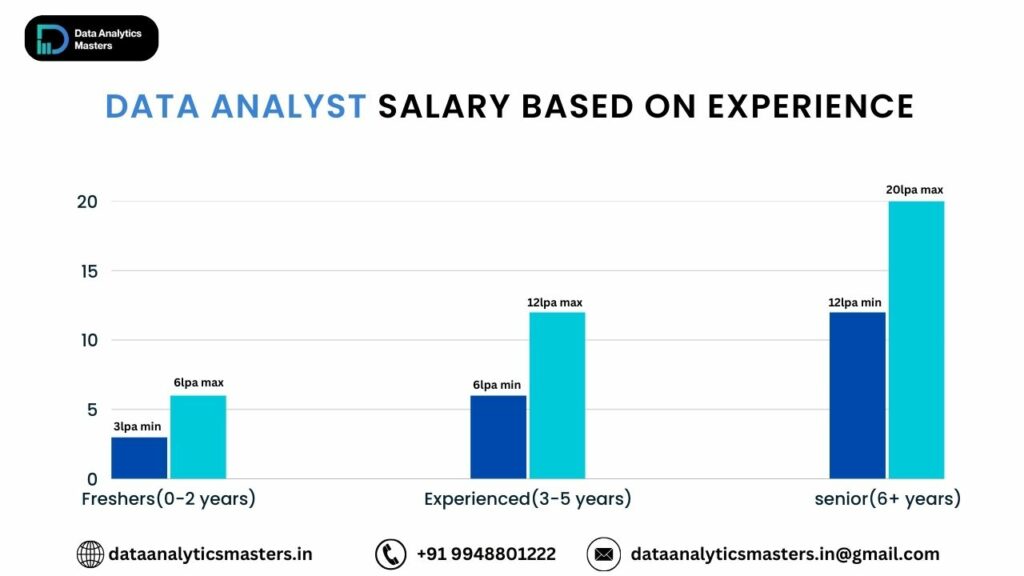
Data Analyst salaries in India
Job Roles and Salaries of a Data Analyst
- Data analytics is one of the fastest-growing fields today, with a wide range of career options and competitive salaries.
- After completing the Data Analytics Course at Data Analytics Masters, you will be well-equipped to pursue various roles in this dynamic industry.
- Here are some of the most popular roles in data analytics and their corresponding salaries at different experience levels:
1. Data Analyst
- Entry-Level Salary (0-2 years): ₹3,00,000 – ₹6,00,000 per year
- Mid-Level Salary (3-5 years): ₹6,00,000 – ₹12,00,000 per year
- Senior-Level Salary (5+ years): ₹10,00,000 – ₹15,00,000 per year
As a Data Analyst, you will be responsible for collecting, processing, and analyzing data to help businesses make informed decisions. You will work with tools like Excel, SQL, and Tableau to visualize data and create reports.
2. Data Scientist
- Entry-Level Salary (0-2 years): ₹5,00,000 – ₹8,00,000 per year
- Mid-Level Salary (3-5 years): ₹10,00,000 – ₹14,00,000 per year
- Senior-Level Salary (5+ years): ₹15,00,000 – ₹25,00,000 per year
Data Scientists use advanced algorithms and machine learning techniques to analyze large datasets and build predictive models. They often work with Python, R, and machine learning frameworks.
3. Business Intelligence Analyst
- Entry-Level Salary (0-2 years): ₹4,00,000 – ₹6,00,000 per year
- Mid-Level Salary (3-5 years): ₹7,00,000 – ₹10,00,000 per year
- Senior-Level Salary (5+ years): ₹12,00,000 – ₹18,00,000 per year
In this role, you will use data to help businesses make strategic decisions by creating dashboards and reports. Power BI and Tableau are essential tools for this role.
4. Data Engineer
- Entry-Level Salary (0-2 years): ₹5,00,000 – ₹7,00,000 per year
- Mid-Level Salary (3-5 years): ₹8,00,000 – ₹12,00,000 per year
- Senior-Level Salary (5+ years): ₹15,00,000 – ₹20,00,000 per year
As a Data Engineer, you will design, build, and maintain systems that collect, store, and process data. Knowledge of SQL, ETL processes, and Big Data technologies is crucial for this role.
5. Machine Learning Engineer
Entry-Level Salary (0-2 years): ₹6,00,000 – ₹9,00,000 per year
Mid-Level Salary (3-5 years): ₹12,00,000 – ₹18,00,000 per year
Senior-Level Salary (5+ years): ₹20,00,000 – ₹30,00,000 per year
Machine Learning Engineers build and deploy machine learning models. Proficiency in Python, deep learning frameworks, and data modeling is required for this highly specialized role.
Roadmap To Become A Data Analyst
- Becoming a Data Analyst is a rewarding journey that involves developing various skills. Here’s a step-by-step roadmap to guide you from starting your learning to landing your first job as a Data Analyst:
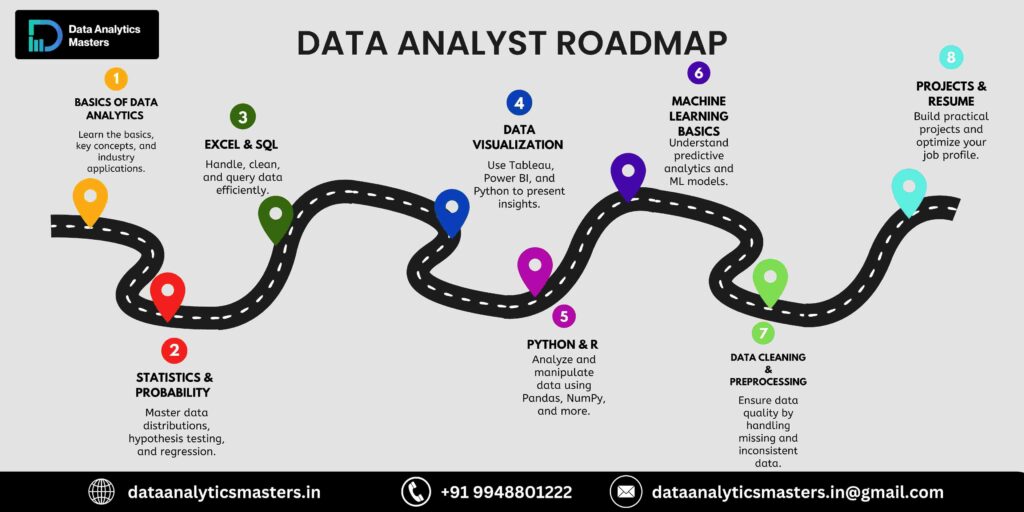
1. Basics of Data Analytics
- Learn fundamental concepts, including data types and industry applications.
- Understand the role of a data analyst and how businesses use data.
- Get familiar with common data sources and collection methods.
2. Statistics & Probability
- Master key statistical concepts like distributions, mean, median, and standard deviation.
- Learn hypothesis testing, regression analysis, and probability theory.
- Apply statistical methods to analyze trends and make data-driven decisions.
3. Excel & SQL
- Use Excel for data cleaning, analysis, and visualization.
- Learn SQL to query databases, retrieve data, and perform complex joins.
- Optimize database queries for efficient data handling.
4. Data Visualization
- Create visual representations of data using Tableau, Power BI, and Python libraries.
- Understand how to communicate insights effectively through charts and dashboards.
- Learn storytelling with data to support decision-making.
5. Python & R
- Learn programming basics in Python and R for data analysis.
- Utilize Pandas, NumPy, and Matplotlib for efficiently handling, analyzing, and visualizing data.
- Automate repetitive tasks and perform statistical analysis efficiently.
6. Machine Learning Basics
- Understand predictive analytics and machine learning models.
- Learn key ML algorithms like linear regression, decision trees, and clustering.
- Explore real-world applications of machine learning in business analytics.
7. Data Cleaning & Preprocessing
- Handle missing, duplicate, or inconsistent data to ensure data quality.
- Use Python, SQL, and Excel techniques to clean datasets.
- Prepare raw data for effective analysis and machine learning models.
8. Projects & Resume
- Work on real-world data projects to gain hands-on experience.
- Build a strong portfolio showcasing problem-solving skills.
- Optimize your resume and LinkedIn profile for job opportunities in data analytics.
Testimonials of Our Data Analytics Course in Hyderabad
Other Related Data Analytics Blogs
FAQ'S about Data Analyst Course Training in Hyderabad
What should I know before starting Data Analytics training?
Before starting your journey in Data Analytics training you should know the
- Basics Computer skills
- Basic Mathematics
- Analytical Thinking
- Understanding of Database
- Programming Knowledge
- Problem-solving skills
What topics will I learn in the Data Analytics Course?
You will learn fundamental concepts of data science, python, SOL, machine learning, deep learning, natural language processing and computer vision.
What are the training modes for Data Analytics Course?
Training is provided in various modes including classroom sessions, Online training, Hybrid training and corporate training programs. For more details you can contact to this number – 9948801222
What tools will be used in the Data Analytics training?
In Data Analytics training we use tools such as Tableau, Power Bi, Advances Microsoft Excel, Ruby language, SQL are used during the training.
What is the duration of the Data Analytics Course?
The duration of the course is 3 months. In this course, we also provide classes for resume preparation tips, mock interviews, and soft skills, so that you can achieve your dream job.
Will I receive a certification after completing the Data Analytics training?
Yes, once the participant successfully completes the course, they will receive a certification from Data Analytics Masters, which is recognized in the industry.
What kind of career support is provided?
Career support includes resume building, interview preparation, job placement assistance, and networking opportunities with industry professionals.
What if I miss any of my classes?
Our training institute provides recorded classes, or you can also join other batches if needed.

 in Hyderabad by Brolly.Group