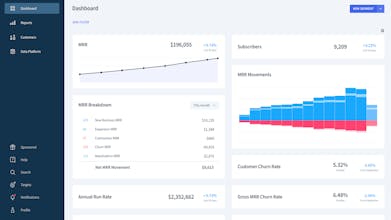
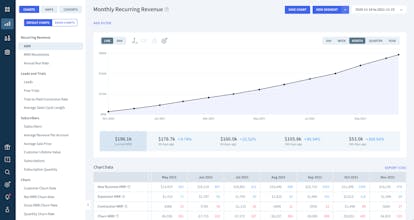
Our subscription analytics platform seamlessly combines and normalizes SaaS revenue data from multiple sources, delivering a clear and accurate view of your B2B SaaS business. You'll be ready to make data-driven decisions that take your business to the next level.
Great UI/UX. Unlike nearly all other SaaS KPI analytics / reporting tools, CharMogul tracks subscription quantity (i.e. users), discounts, CMRR, and allows you to export a MRR per customer by month excel file. Other great features include: MRR editing, subscription connecting, flexible segmentation, and tagging. That being said, there are three major draw backs, both of which are not insignifcant: 1) ChartMogul's numbers rarely ever tie to that of Stripe's; 2) pricing is usage based which means the more you grow, the more you pay, and 3) fairly unresponsive and hands-off customer support. If they could fix the first and improve the third, this would be a near perfect SaaS analytics tool.