
Datastory
Turn the world's data into stories worth sharing
101 followers
Turn the world's data into stories worth sharing
101 followers
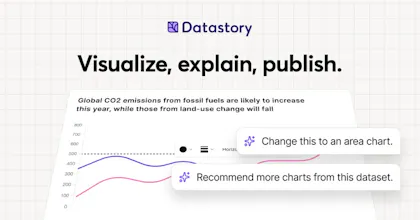
Datastory is the no-code platform for data storytellers. Create interactive charts, websites, and reports with AI, and access a growing catalog of open datasets.


Free Options
Launch Team / Built With


Hi Product Hunt! Daniel here, founder of Datastory.
I've spent my career making data understandable and useful: from animating Hans Rosling's TED Talks at Gapminder to building data platforms for the Red Cross, the UN Statistics Division, Brookings and Sweden's national health registries.
Every project showed me the same thing: organizations were building similar platforms from scratch, at great cost. Communicating data well was still slow, expensive, expert work.
We started Datastory as a non-profit, publishing data journalism and building our own tools because nothing else was fast enough. Over time the tools became the product, now used by public agencies, researchers and newsrooms.
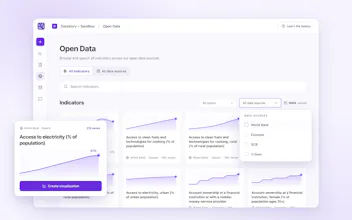
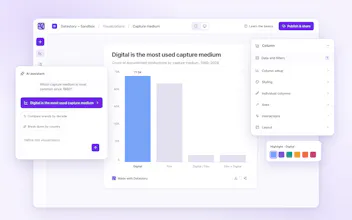
Bring your own data or use our curated open data catalog, and publish interactive charts that you can embed anywhere. AI drafts, you refine. No code needed.
The free plan allows testing the full range of features. Try it and tell us what's missing. We'll be here all day.
PS: We’re rolling out more templates and open datasets weekly.
Follow us on LinkedIn for more opportunities.
Hey Data story folks,
On mobile, there's no way to add an indicator from Browse data to the prompt. You can select one, but the "Add to prompt" button sits in the preview pane, and that pane is hidden on screens narrower than a tablet. Tapping Done just closes the dialog, so nothing gets added. Could we fix this so people on phones can add what they've selected?
@trentwoodbury I think we can, and with any luck before the deadline. Would you mind asking as a hypership request? That gets us a few more points when we fix it.
Hi Daniel, my spreadsheets tend to die in a browser tab where nobody sees them. Making numbers folks stop and read, that'd win me over. it's neat work ;)
@amine_aziz_alaoui Thank you! We support just pasting the data from spreadsheets into our prompt. Would be exciting to see what you come up with! We have a competition starting in a few days for the best interactive chart, would be fun if you joined! 💚
@amine_aziz_alaoui it's possible to upload excel files now! 🎉
question on the embeds: if I hook up a live data source and publish a chart, does the embedded version update on its own when the source changes, or is it frozen at whatever the data looked like on publish day? I've got a couple of dashboards I'd want to just set and forget, not rebuild every month.
@galdayan If it's data catalog based chart and you don’t set fixed time filter the chart will update when the new data comes in
Congrats on the launch! Turning raw data into shareable stories is the part most tools skip, so it's great to see it treated as the goal. The chart preview polish matters more than people admit — nice work.
@karimbenkeroum thank you!