
Launched this week

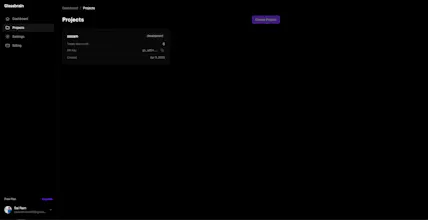
Glassbrain
Visual trace replay for AI apps to fix bugs in one click
102 followers
Visual trace replay for AI apps to fix bugs in one click
102 followers
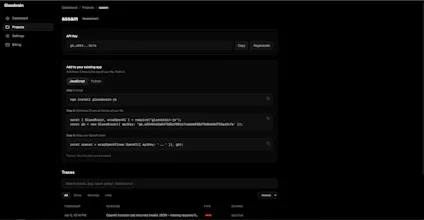
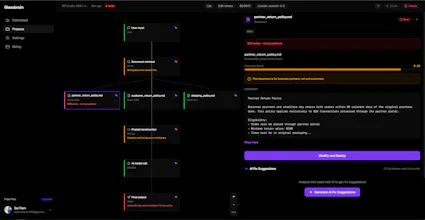
Glassbrain captures every step of your AI app as an interactive visual trace tree. Click any node, swap the input, replay instantly without redeploying. Snapshot mode stores deterministic replays. Live mode hits your actual stack. Auto-generated fix suggestions reference exact trace data with one-click copy. Diff view shows exactly what changed. Shareable replay links let your team debug together. Works with OpenAI and Anthropic. Two lines of code to integrate. Free tier: 1K traces/month.


Glassbrain
@sai_ram_muthineni The replay part is the hook for me. Finding a bad run is one thing. Getting back to it cleanly is usually where time disappears. Does replay end up replacing manual log digging for most teams?
Glassbrain
@artem_kosilov Hey Artem, exactly right. Finding the bad run is maybe 10% of the pain. The other 90% is reproducing it, isolating which node broke, and testing a fix without breaking everything else.
Replay handles all of that. You click the node that failed, change the input, and fire it again right there. No log digging, no redeploying, no "let me reproduce this in staging."
On top of that Glassbrain also auto-suggests fixes referencing the exact trace data, so you're not even starting from scratch figuring out what to change. For most teams yeah, that whole workflow just goes away.
The replay without redeploying part is what got me. Does it work with any LLM framework or do you need to set up a specific SDK? Asking because I'm on a custom Claude API setup and always dread the debug process.
Glassbrain
@abhra_das1 Hey Abhra! So you do need the SDK, but honestly it's two lines. Just wrap your Anthropic client with wrapAnthropic and you're good to go. No framework, no setup headache.
The replay thing works because Glassbrain snapshots your exact call (prompt, params, model version, all of it) so when something breaks you just go into the dashboard, tweak the input, and fire a real call right there. Never touch your codebase. For someone who dreads the debug process this is kind of the whole point. Give the free tier a shot, would love to hear how it goes with your setup!
Two lines of code to integrate is the right move. Half the reason I avoid adding observability to my projects is the setup overhead. The visual trace tree vs. walls of JSON logs is a real upgrade. Quick question - does it handle multi-step chains where one node calls another model mid-pipeline, or is it mainly single-call tracing?
Glassbrain
@thenomadcode Hey Christophe, yeah it handles multi-step chains. The SDK wraps your Anthropic/OpenAI client, so every call from every step gets captured automatically. Whether it's a single completion or a 10-step agent pipeline with retrieval, tool calls, and nested LLM calls, each node shows up in the tree with its own inputs, outputs, latency, and tokens.
You get the full execution graph, so when something breaks three steps deep you can see exactly which model call produced the bad output and replay from that specific node. It also picks up LangChain and LlamaIndex pipelines since those wrap the same underlying clients.
The prompt drift thread is the interesting part. Knowing when outputs shift is often more useful than logging what each call returned. Are you planning regression-style monitoring where replay runs automatically on a schedule and flags drift before users notice?
Glassbrain
@avi_pilcer1 Yeah Avi, that's exactly the direction. The replay infrastructure already stores everything we need - exact prompts, params, model versions, original outputs - so wiring up scheduled regression runs is more of a scheduling problem than a hard one. The plan is: pick a set of "golden" traces per project (your critical paths), run them on a cadence, diff against the stored baseline, and alert when outputs drift beyond a threshold.
The interesting part is what counts as "drift worth alerting on." Exact string match is too noisy because LLMs vary even at temperature 0. Semantic similarity is better but expensive at scale. Probably something like: structural diff (did the JSON shape change, did a citation disappear, did the tool call sequence change) for fast checks, with semantic embedding diff as a fallback for free-form text. Still figuring out the right thresholds.
If you've thought about regression testing for AI before I'd love to compare notes - this is the kind of feedback that actually shapes the feature.
the deterministic replay mode is the part I'd actually use most. debugging AI agents by re-running against fixed inputs without live calls is a pain point that keeps coming up.
Glassbrain
@mykola_kondratiuk Hey Mykola, yeah this comes up constantly with agents. The snapshot side of it stores everything deterministically (full prompt, params, model version, tool outputs) so you always have the exact state of a run to go back to.
Worth being upfront though: replay does make real LLM calls via your API key, it's not a fully offline re-run. What it removes is the "reproduce this in your codebase and redeploy" part, which is usually where the time actually goes.
Determinism helps with replay, but prompt drift still makes outputs diverge. Reproducibility is harder than it looks.
Glassbrain
@mykola_kondratiuk Totally fair point Mykola. Prompt drift is real - same input, same model, same temperature, different output is a known headache especially across model version updates.
What Glassbrain does help with is making drift visible instead of invisible. You can replay the exact old prompt/params against the current model and immediately see what changed. So when OpenAI or Anthropic quietly updates a model under the same name, your replay diff shows you the delta side by side. It doesn't freeze the model's behavior, but it gives you a baseline to compare against.
For full reproducibility you'd need to pin model snapshots on the provider side (gpt-4o-2024-08-06 vs just gpt-4o) which is an upstream problem, but Glassbrain at least surfaces when drift happens so you're not debugging blind. Appreciate the honest pushback - this is the kind of nuance we're still figuring out.
solid approach. does the replay trigger automatically on model version changes or do you kick it off manually?
Huge congrats on the launch! The ability to replay a failed run from a specific node without having to redeploy the whole codebase is a massive time-saver. Does the 1K free tier count every individual node click as a trace, or just the full pipeline run?
Glassbrain
@natanel_alaev Thanks Natanel, appreciate it. Great question - just the full pipeline run counts as a trace, not individual nodes. So one end to end call to your AI app, whether it's a single LLM completion or a 15 node agent pipeline with retrieval and tool calls, is one trace against your 1K free tier.
Clicking around inside a trace to inspect nodes is free, and replays don't count against the trace quota either (they hit your own API key on the LLM side). The 1K is really about how many real runs your app does per month, which keeps it predictable. Most devs on the free tier are building something new and using it for a few weeks of dev/testing before deciding to upgrade.