
Navigara connects AI coding performance directly to your engineering roadmap. Analyzing code like a senior engineer to prove real capacity gains, Navigara tracks exact costs per roadmap item, isolates off-roadmap waste, and identifies maintenance burn. Cut spend further by automatically routing routine CRUD tasks to low-cost models without sacrificing quality. Connects in minutes via Git history, JIRA/Linear, and any AI coding license for spend.




What's great
The idea of scoring engineering work by complexity reduction instead of raw lines or commit count is genuinely refreshing - most "AI ROI" tools just count tokens or PRs merged, which tells you nothing about whether the work was actually good. The maker's own framing (a $150k/month AI spend that nobody could actually justify) is a real problem a lot of teams have right now and don't have a good answer for. Splitting the score into Features/Maintenance/Fixes/Documentation instead of penalizing cleanup work as "zero output" is a smart touch too.
What needs improvement
Would like to see the metric-gaming angle addressed more directly - once engineers know complexity-reduction is being scored, it's an easy target to game with cosmetic refactors. Some guardrails or a note on how the team-level view catches that would make the pitch stronger.
vs Alternatives
We'd looked at generic dev-analytics dashboards (cycle time, PR counts) before, but they don't connect spend on AI coding tools to the roadmap at all - Navigara's angle of tying token cost to specific roadmap items and flagging off-roadmap work is a different category, not really a swap for what we had.
Ratings
Ease of use
Reliability
Value for money
Customization
Report
28 views
Hey, Product Hunt ✋,
I'm Jirka, co-founder of Navigara.
I spent years as a CTO trusting the velocity charts, cycle times, right up until I realized they were telling me a story I couldn't back up. Then a CFO asked whether Claude was producing real value for almost $150k a month or just producing invoices, and the honest answer was "we think so." Try saying that out loud while asking for a bigger token budget.
So we built Navigara. It reads your commit history, uses an LLM to understand the repo and explain what each change did, then scores how complex the merged work was. Not lines, not commits. Refactor 400 lines down to 40 and you score higher than shipping 400 more. Full methodology behind Engineering Throughput Value: https://500.navigara.com/methodology. ETV splits into Features, Maintenance, and Documentation. We measure against your team's own pre-AI baseline.
We pointed it at open source first and created a white paper about this. The result? Across the public commit history of Microsoft, Google, Cloudflare, OpenAI, Meta, and Vercel, ETV per engineer rose 116% between Q1 2025 and Q1 2026, measured across 676 contributors.
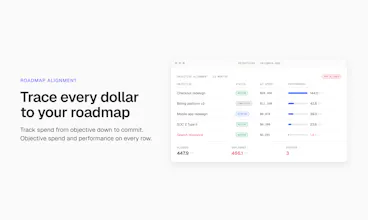
Then we noticed that a lot of the performance and code created inside companies was not aligned with the company roadmap. So the spend was high and a lot of PRs were generated, but the roadmap did not move that much faster. So we connected token spend to the roadmap (initiatives, epics, and tickets) to see what work is aligned with your roadmap, what just has a ticket without an initiative, and what is unaligned with your roadmap and put number in $ next to it.
Here’s the part I care about most: Lead engineering with data. My engineering team's ETV per engineer is up 4x against our own pre-AI baseline. We are realizing that process issues between epics, tickets, AI spend, and code are the source of teams slowing down as they grow in headcount. If you care about this too, check out “Process Checks.” It is like Sentry, but for engineering processes.
You can start a 14-day trial, or just poke around at navigara.com first. If you think we're measuring engineering wrong → That's the feedback I really want.
Jirka
@bachel Nice launch congrats🙌linking token spend directly to business output solves a massive headache for CFOs. qq how are you handling privacy/security when scanning proprietary repos for this?
@priya_kushwaha1 Three deployment modes, depending on what your security posture requires.
Fully on-prem for banks and regulated enterprises. Everything runs inside your perimeter, model included. Nothing crosses the boundary.
On-prem collector for teams that want the code to stay put. Reads git history locally, ships out scores and metadata. No source, no diffs.
Hosted for teams that want results today. You connect git, Linear or Jira, and your AI spend. Code is processed and not retained, and never used for training.
We hold SOC 2 · ISO 27001 (Q3 '26).
Happy to send the architecture doc if your security team wants to take it apart.
https://docs.navigara.com/security/best-practices
@bachel makes total sense. the on-prem collector option really hits the sweet spot for balance between speed and security.
@priya_kushwaha1 Yes, most of our big customers are using this option. We have purposely optimized our documentation for on-prem deployment, so the person deploying it can just copy-paste our documentation into Claude, and it is done.
@bachel how does the onprem collector calculate ETV and score complexity without actually sending diffs or source code out? routing routine CRUD to cheaper models is a smart way to actually manage a $150k a month claude bill.
@mohsinproduct Thank you :)
When we are deployed on-prem, we use our customers’ LLMs.
Hi Product Hunt 👋,
Peter here, CTPO and co-founder of Navigara. Thank you so much for all the love we've received during our launch. I want to share bits from what we are working on right now.
Connecting your AI spend to what you work on is the starting point. Spend in the right direction, and you get 10x. Spend on the right thing in that direction, and you get 100x. I might know that the local community needs a shoe store - that's 10x. The precision of knowing they need running shoes in particular takes me to 100x. Focus matters.
This is why we're building Context Chain. Your roadmap is not just a bunch of text. It should be interconnected brain of your business. By answering the right questions, you will find out much sooner what is and what is not worth it, as well as what do you need to discover before you commit to your ideas.
This feature has been helping us quitely for weeks now, and we will be introducing in the upcoming month to all Navigara customers.
I am curious how ETV behaves across different engineering disciplines. would the methodology work equally well for backend, frontend, DevOps, infrastructure and data teams?
@jones_rhys It does over time. Boilerplate generated by frontend / backend / devops / data teams will differ at the start, so we see differences in the throughput in the first month of greenfield projects. As the projects stabilize, there's little performance gaps between high-performing teams and individuals across disciplines. Cognitive absobtion of complexity becomes the bottleneck, which is what ETV is designed to reflect.
Don’t forget to check out our public data. We are updating 500.navigara.com daily.
How Top Engineering Teams Actually Perform today?
A live index of the industry's leading engineering orgs. Every commit is weighted by the work it represents, not the lines it touched, and reported as ETV per engineer.
Here is a detailed view of how the token spend looks when it is connected to the roadmap.
Congrats on the launch, much needed product! 👏
@mikolaj_kacki1 Thank you, Miko 🥰
Congrats on the launch day!
@alexcloudstar Thank you 🤗