

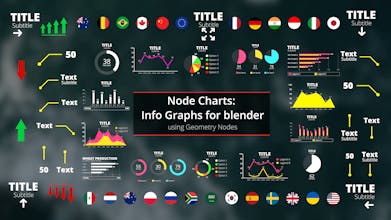
Node Charts: Info Graphs For Blender
Create stunning charts for Blender using Geometry Nodes
1 follower
Create stunning charts for Blender using Geometry Nodes
1 follower
The Geometry Nodes update in Blender allows users to create procedural models. With Info Graphs for Blender, you can easily add data charts to your projects, saving you time and effort instead of designing from scratch.


Free Options
Launch Team

PinMe — Publish Sites in Seconds. Tamper-proof by design.
Publish Sites in Seconds. Tamper-proof by design.
Promoted

Maker
📌Report