Universal Data Visualization

Charts and infographics constructor in Figma

4 followers

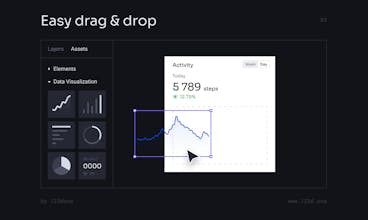
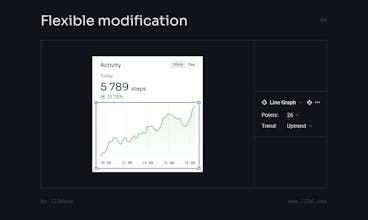
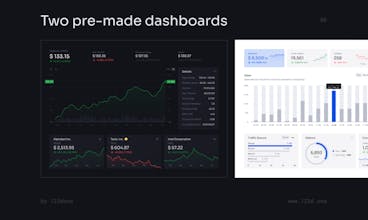
Universal Data Visualization is a high-quality tool for creating charts and infographics in Figma. Easy way to visualize your data in seconds.
Universal Data Visualization 1.0 gallery image
Payment Required
Launch tags:Design Tools
Launch Team
Intercom
Intercom
Startups get 90% off Intercom + 1 year of Fin AI Agent free
Promoted

What do you think? …

This is awesome @dimagroshev 🙌🏼🙌🏼
Dima Groshev
@saascoach Thank you so much!
@dimagroshev You are welcome 🌟
Dima Groshev
Hello, PH! I'm excited to introduce Universal Data Visualization v1.0. A high-quality tool for creating charts and infographics in Figma. Easy way to visualize your data in seconds. Visit website Preview DATA VISUALIZATIONS — Line Graph — Donut Chart — Pie Chart — Bar Chart (Vertical) — Bar Chart (Horizontal) — Number YOU WILL GET — Getting Started (Guide) — Two pre-made Dashboards — 80+ pre-made Blocks — 100+ Components — Styleguide — 105 Icons Feel free to send me your feedback. I appreciate your comments, likes and shares.
Chris Messina
@dimagroshev are the charts made with customizable data, or are they just useful for mockups?
Dima Groshev
@chrismessina Yes, of course! You can customize the data for your preferences. It's a flexible constructor. Let me know if you need help with this.
Dima Braven (itmeo.com)
Nice design man!
Dima Groshev
@dimabraven Thank you!
Simon Barker
This looks great, I do love a nice chart. Great looking Instagram as well!
Dima Groshev
@simon_barker1 Thank you so much for your feedback!
Dmitry Romanov
Great job!
Dima Groshev
Thank you so much!